
The Legacy Performance Crisis: How Core Web Vitals Affect Google Rankings
An enterprise portal completes a major content refresh and expects a surge in organic visibility — but instead drops four positions immediately after the March 2026 Google core update. The content is strong. The domain authority is high. The problem is something invisible: the page looks ready before it actually is. Users see the layout, try to click, and nothing responds. Google measures that gap and penalizes it.
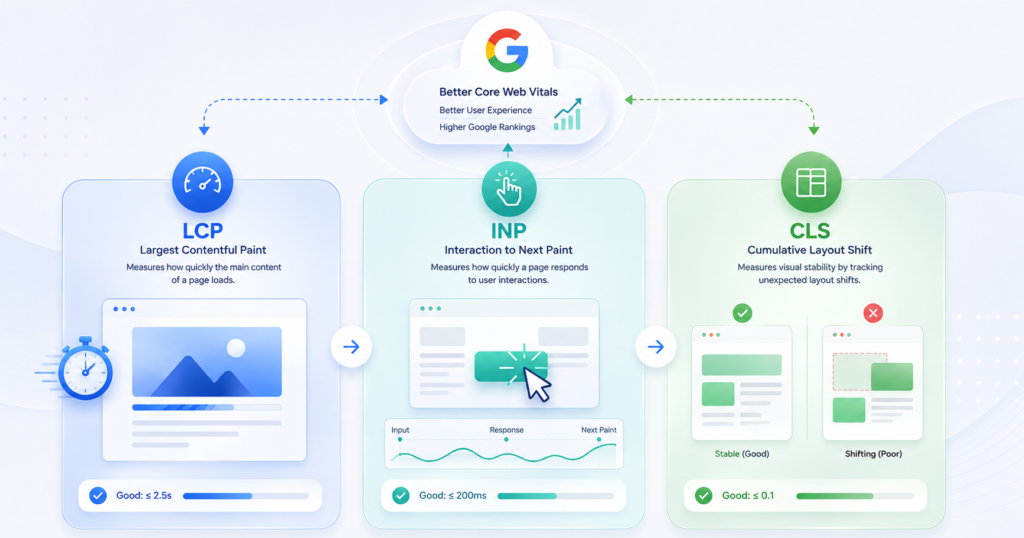
Core Web Vitals are the three metrics Google uses to quantify this experience. Largest Contentful Paint (LCP) measures how fast the main content visually loads. Interaction to Next Paint (INP) measures how quickly the page responds to every click, tap, or keystroke throughout a session. Cumulative Layout Shift (CLS) measures whether page elements stay visually stable during load. According to Google’s Search Central documentation, the “good” thresholds are LCP under 2.5 seconds, INP under 200 milliseconds, and CLS under 0.1 — all evaluated using real-user field data from the Chrome User Experience Report (CrUX), not lab simulations.
The March 2026 core update raised the stakes. INP was confirmed as a primary ranking signal with equal weight to LCP and CLS. Post-update analysis tracking over 10,000 domains by Digital Applied found that pages with INP above 500ms dropped two to four positions on competitive queries.
The business cost is direct. Akamai research found that a one-second delay in page load time reduces e-commerce conversions by approximately 7% — meaning a platform generating $100,000 per month absorbs roughly $84,000 in lost annual revenue from a single second of avoidable delay. On the upside, e-commerce sites that bring all three metrics into the “good” range have documented conversion improvements of 15–30% and organic traffic gains of 12–20% following comprehensive performance optimization.
With over 60% of global searches now happening on mobile, unoptimized JavaScript and outdated infrastructure are no longer just technical debt — they are a direct drag on search visibility. Organizations that delay performance modernization quietly cede organic position to faster competitors.
LCP, INP, and CLS: What Each Metric Measures and What Failing One Actually Costs
Google does not judge your site on its best day. It evaluates the 75th percentile of real-user interactions collected over a rolling 28-day window through the Chrome User Experience Report (CrUX). In plain terms: at least 75 out of every 100 real visitors must have a “good” experience for a URL to pass. One metric in the “needs improvement” band is enough to fail the entire assessment.
The three metrics that determine that pass or fail are:
| Metric | What It Measures | Good Threshold | Poor Threshold | Ranking Impact of Failure |
|---|---|---|---|---|
| Largest Contentful Paint (LCP) | How fast the main visible content loads | Under 2.5 seconds (Google Search Central) | Over 4.0 seconds | Bounce rate spikes; 2–4 position drops on competitive queries |
| Interaction to Next Paint (INP) | How fast the page responds to every click, tap, or keystroke throughout the session | Under 200 milliseconds (Google Search Central) | Over 500 milliseconds | Abandoned forms, poor engagement, measurable ranking drops |
| Cumulative Layout Shift (CLS) | Whether page elements stay visually stable during load | Under 0.1 (Google Search Central) | Over 0.25 | Accidental mis-clicks, loss of trust, higher exit rates |
One metric also worth monitoring, though not yet a primary ranking signal, is the Visual Stability Index (VSI), introduced by Google in early 2026. Where CLS only captures layout shifts during the initial page load, VSI tracks visual stability across the entire browsing session — including during scroll. Google is actively collecting VSI data through CrUX, and based on the rollout pattern of previous Core Web Vitals, it is expected to become a hard ranking factor within the next 12–18 months.
While VSI represents where Google is heading, the most consequential change that has already happened is the replacement of First Input Delay (FID) with INP.
While VSI represents where Google is heading, the most consequential change that has already happened is the replacement of First Input Delay (FID) with INP. FID only recorded the delay before the browser processed the very first interaction — a single data point that was easy to game and told very little about real-world responsiveness. INP captures every interaction across the full session and reports the slowest one at the 75th percentile. A page that felt fast on first click but froze on the third button press would pass FID and fail INP. That is a significantly stricter standard — and the reason INP is now the metric most organizations discover they are failing when they first pull their CrUX field data.
Your Desktop Scores Are Irrelevant — Here Is What Google Actually Ranks On
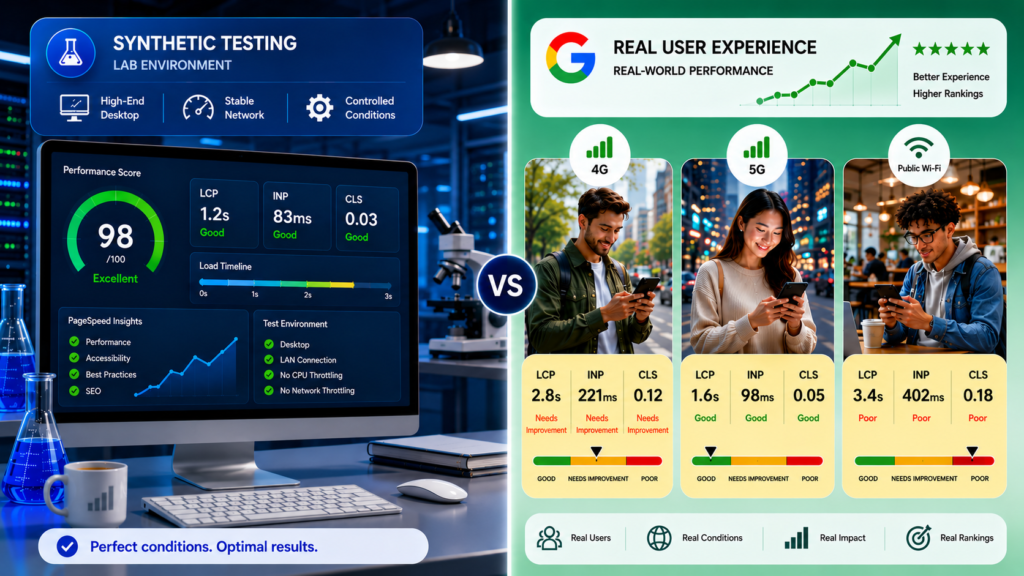
Google’s mobile-first indexing means the mobile version of your site is the primary version used for crawling, indexing, and ranking — for every device, including desktop. A site that scores well only on high-speed desktop connections is not being evaluated on its strongest performance. It is being evaluated on its weakest.
This creates a problem many enterprise teams never catch. As of mid-2025, mobile devices accounted for over 60% of global web traffic, according to StatCounter data published by Statista. That majority is browsing on varying network speeds and mid-range consumer hardware — conditions that look nothing like a controlled Lighthouse test run on a developer’s machine.
The table below captures why that distinction matters for rankings:
| Characteristic | Synthetic Lab Data (Lighthouse) | Real-User Field Data (CrUX) |
|---|---|---|
| Data Source | Emulated environment under fixed conditions | Actual Chrome browser sessions from real visitors |
| Network Conditions | Simulated, controlled connection | Diverse hardware and varying network speeds |
| Interactivity Capture | Total Blocking Time (TBT) as a proxy | Exact Interaction to Next Paint (INP) measured live |
| Used by Google for Rankings | No | Yes — this is the data Google ranks on |
The practical consequence is straightforward: an enterprise portal perfectly optimized for desktop but struggling with latency or layout shifts on mobile will absorb ranking drops that its engineering team may never trace back to the right cause. And the problem does not stop at the homepage. Every URL group Google evaluates — product listings, blog templates, portal dashboards — must pass the 75th percentile threshold independently. One slow template can drag down an otherwise healthy site.
Beyond Image Compression: What Real Core Web Vitals Remediation Looks Like
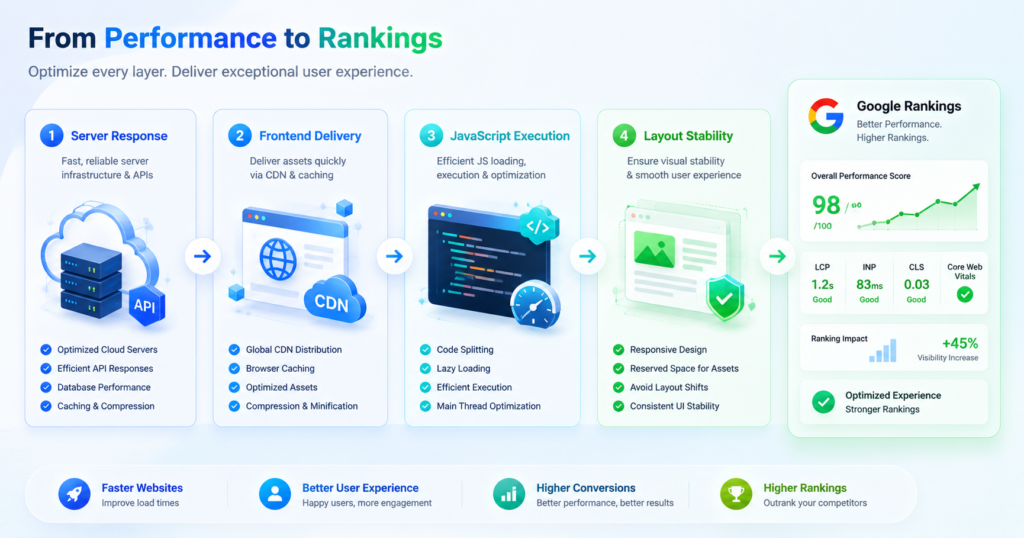
Passing Core Web Vitals consistently across an entire URL portfolio — not just a single optimized homepage — requires changes at three distinct layers: server response, frontend delivery, and JavaScript execution. Superficial fixes like image compression or caching plugins address symptoms. The following categories address the underlying architecture.
Server Response: The Foundation of LCP
Every LCP score starts at the server. If the backend takes too long to generate and deliver HTML, the browser cannot begin rendering — and LCP suffers before a single image or script is involved. This server response time is measured as Time to First Byte (TTFB).
For organizations running .NET-based backends, .NET 10’s Native Ahead-of-Time (AOT) compilation is a meaningful architectural upgrade. Rather than compiling code at runtime using a JIT compiler, Native AOT compiles the application to native machine code at build time. According to Microsoft’s official ASP.NET Core documentation, this results in faster startup times, reduced memory demand, and smaller deployment footprints — advantages that compound in containerized and cloud environments where instances scale frequently. In serverless workloads specifically, cold start reductions of up to 80% have been documented in production implementations.
Frontend Delivery: The Speculation Rules API and LCP
For multi-page applications, the Speculation Rules API is one of the most impactful tools available for LCP improvement. Rather than waiting for a user to click a link before fetching the next page, the API allows the browser to prefetch or fully prerender high-probability next pages in the background — invisibly, before the user acts.
Prerendering goes further than prefetching: it downloads the full HTML, all subresources, and renders the complete page in a hidden background tab. When the user clicks the link, the browser swaps in the already-rendered page rather than loading from scratch. Real-world monitoring data from CoreDash across multiple production sites shows prerendered navigations achieving a 75th percentile LCP of 320 milliseconds, compared to 1,800 milliseconds for standard navigations on the same sites — an 82% improvement from a single implementation change. It is worth noting that the Speculation Rules API currently functions only in Chromium-based browsers; Firefox and Safari do not yet support it.
JavaScript Execution: The Root Cause of INP Failures
The most common cause of a failing INP score is JavaScript that blocks the browser’s main thread. When a user clicks an interactive element, the browser cannot paint the next visual frame until any long-running JavaScript task currently occupying the main thread completes. The user sees the click register but the interface does not respond — and that delay is what INP measures and Google penalizes.
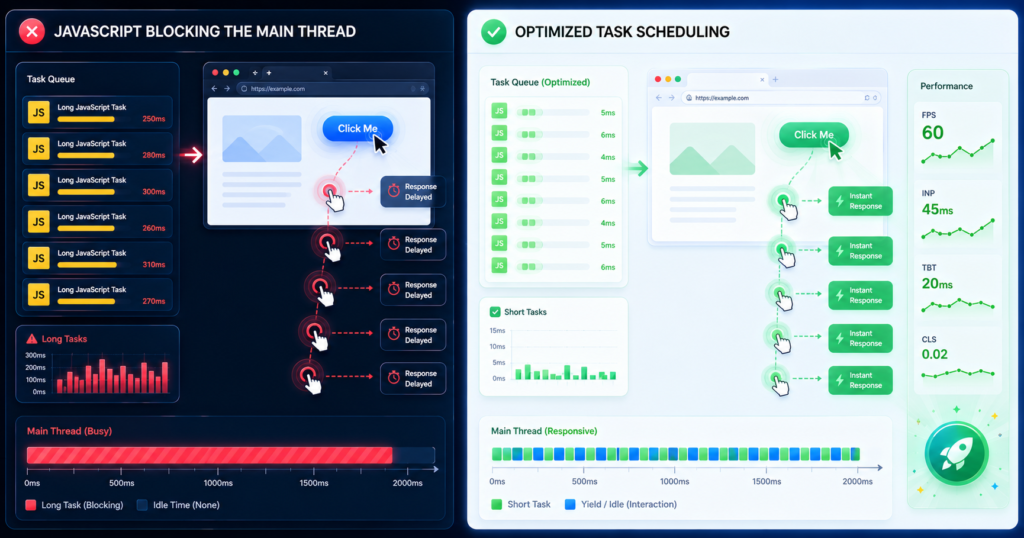
Fixing this requires breaking long JavaScript tasks into smaller, non-blocking chunks and yielding control back to the browser between them. The native Scheduler API (scheduler.yield()) enables developers to do this without third-party libraries, allowing pending interactions to be processed before background work resumes. This is an architectural discipline, not a configuration change — and it is why 43% of sites still fail the 200ms INP threshold despite years of awareness.
Layout Stability: Preventing CLS at the Source
CLS failures almost always trace back to the same two causes: images and media elements loaded without explicit dimensions, and content injected above existing page elements after the initial render — ads, cookie banners, and dynamic components being the most common offenders. The fix is architectural discipline rather than a tool: every image, video, and ad slot needs reserved space defined before the content loads, so the browser never has to shift existing elements to accommodate something arriving late.
The table below summarises the legacy problem and the modernised approach at each of the four architectural layers covered in this section.
| Layer | Legacy Problem | Modernized Approach |
|---|---|---|
| Server Rendering | JIT compilation overhead and cold starts | Native AOT compilation (.NET) or equivalent server-side optimization — faster startup, lower memory |
| Page Delivery | Standard navigation — full load on every click | Speculation Rules API — prerendered pages load near-instantly |
| JavaScript Execution | Long tasks block the main thread | Task splitting and main-thread yielding via Scheduler API |
| Layout Stability | Missing image dimensions and dynamic elements | Explicit aspect ratios and reserved space for ads and embeds |
What Happens to Revenue When Core Web Vitals Actually Improve
Abstract performance goals only earn executive buy-in when they translate into revenue numbers. The following results come from Google’s own web.dev case study library — each conducted as a controlled A/B test, with performance optimization as the only variable changed.
| Brand | Metric Optimized | Documented Business Outcome |
|---|---|---|
| Rakuten 24 | Largest Contentful Paint (LCP) | 53.37% increase in revenue per visitor; 33.13% rise in conversion rate |
| Vodafone Italy | LCP via server-side rendering and JS reduction | 31% LCP improvement drove 8% more sales, 15% better lead-to-visit rate, 11% higher cart-to-visit rate |
| redBus | Interaction to Next Paint (INP) | 72% INP improvement through thread-blocking script optimization; 7% increase in sales |
| Ray-Ban | LCP via Speculation Rules API prerendering | 43% LCP improvement; 101.47% surge in mobile conversion rates on product pages |
Three things make these figures worth paying attention to. Every result above came from an A/B test where the only difference between groups was Core Web Vitals optimization — no redesigns, no new features, no additional marketing spend. The outcomes span all three metrics: Rakuten 24 demonstrates the revenue impact of LCP, redBus demonstrates the sales impact of INP, and Ray-Ban demonstrates what a single frontend delivery change can do to conversion rates at scale. All four are published by Google on web.dev — not modeled projections or vendor estimates.
The pattern is consistent: when page experience improves measurably for real users, business outcomes follow.
Achieving results like these requires engineers who work from field data, not lab scores — and who can trace a failing metric back to its actual architectural cause rather than its most obvious symptom. That is precisely the work the Vedhas Technology Solutions engineering team is built to do.
Performance Is Not a Project. Here Is How to Treat It Like Infrastructure.
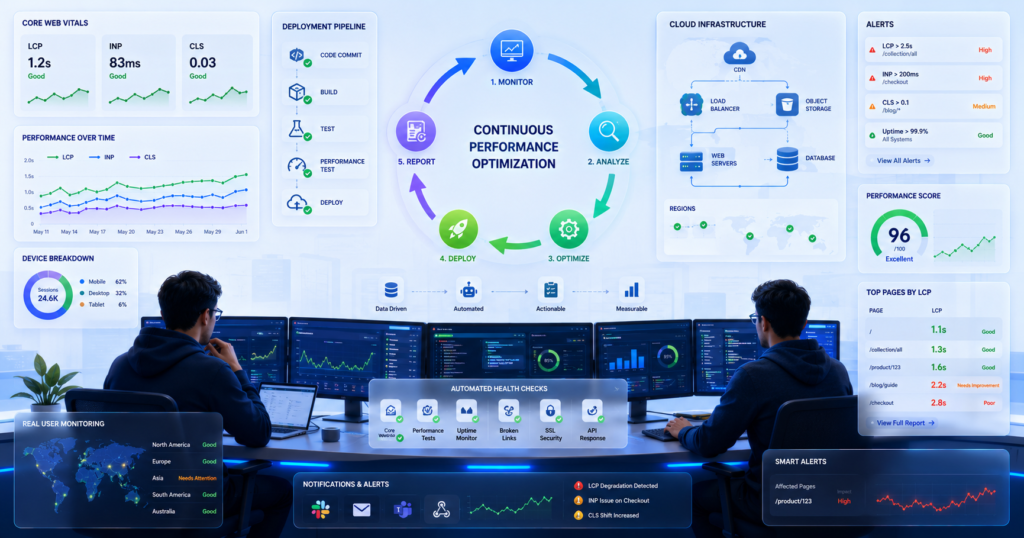
Core Web Vitals scores are not a permanent achievement. A new third-party script added to a landing page, a content update that introduces undimensioned images, or a JavaScript dependency upgrade can push a passing score into “needs improvement” territory — and with Google’s 28-day CrUX rolling window, that regression will quietly affect rankings before most teams notice it.
Treating performance as a continuous discipline rather than a periodic project requires a clear division of ownership across teams. The following framework assigns the right work to the right people:
| Team Role | Essential Activities | Primary Tools |
|---|---|---|
| Marketing Specialists | Audit third-party marketing tags, optimize image formats, track organic performance trends | Google Search Console, Screaming Frog |
| Frontend Engineers | Set explicit image dimensions, inline critical CSS, implement code splitting, monitor INP regressions after deploys | Chrome DevTools, PageSpeed Insights |
| Infrastructure Architects | Enable edge caching, optimize database queries, reduce TTFB, manage server-side rendering configuration | Google Cloud Console, Cloudflare CDN |
The division matters because Core Web Vitals failures rarely have a single owner. A failing LCP might be a server response problem, an unoptimized hero image, or a render-blocking stylesheet — and each of those sits in a different team’s domain. Without clear accountability, regressions get noticed late and fixed slowly.
Getting that ownership structure right is only half the equation. The other half is making sure the data each team is working from actually reflects what Google measures.
Most organizations are working from lab data — Lighthouse scores, PageSpeed Insights reports run on a handful of pages. That is useful for diagnosis but it is not what Google ranks on. Google ranks on CrUX field data: the 75th percentile of real user sessions across every URL group on the site, measured over a rolling 28-day window. A site can have a Lighthouse score of 90 and still be failing Core Web Vitals in Google Search Console.
The engineering team at Vedhas Technology Solutions offers a complimentary Technical Web Speed and Core Web Vitals Audit for organizations that want to understand their real-user field data — not their lab scores. The audit identifies which URL groups are failing, which architectural layers are responsible, and what the specific fixes are. Organizations that close the performance gap now will compound that advantage through every algorithm update that follows.
Frequently Asked Questions About Core Web Vitals
Are Core Web Vitals the same for every type of website?
No. The metrics are the same, but performance expectations and optimization priorities can vary based on the website’s architecture, content, functionality, and user behavior.
How often should a business audit its Core Web Vitals?
Core Web Vitals should be monitored continuously and formally audited after major website updates, redesigns, platform migrations, or significant changes to third-party scripts.
Can third-party tools negatively affect Core Web Vitals?
Yes. Analytics scripts, chat widgets, advertising tools, consent managers, and embedded content can increase loading and processing time, potentially affecting LCP, INP, and CLS.
Do Core Web Vitals affect all pages on a website equally?
No. Google evaluates performance at the URL level and may also use data from groups of similar pages when sufficient page-specific field data is unavailable.
How long does it take for Core Web Vitals improvements to appear in Google data?
Field data is based on a rolling 28-day collection period, so improvements may take several weeks to become fully visible in Core Web Vitals reports.