Key Takeaways
- Average Cost Ranges: Simple mobile applications cost between $15,000 and $35,000, medium-complexity apps range from $35,000 to $90,000, and enterprise-grade or feature-rich custom platforms cost $90,000 to $250,000+.
- Native vs. Cross-Platform Savings: Cross-platform frameworks like Flutter and React Native reduce initial development expenses by 30% to 40% compared to separate native iOS (Swift) and Android (Kotlin) codebases.
- Infrastructure Overhead: Cloud backend infrastructure (AWS, Google Cloud, Azure, Firebase) adds $100 to $2,500+ per month depending on active user concurrency, data bandwidth, and database queries.
- Store Publishing Fees: Apple charges an annual developer fee of $99/year ($299/year for Enterprise), while Google Play charges a $25 one-time registration fee (Source: Apple Developer Program & Google Play Official Documentation). Standard store commissions are 30% (reduced to 15% for eligible small businesses making under $1 million annually).
- Long-Term Maintenance: Ongoing maintenance, updates, and monitoring require 15% to 20% of the original development cost per year to maintain OS compatibility and system security.
Navigating Your Mobile App Investment in 2026
Evaluating the total mobile app development cost is a pivotal financial step for executives, product leaders, and enterprise decision-makers planning custom digital products in 2026. Whether you are launching a customer-facing portal, an enterprise workflow tool, or a consumer marketplace, mobile software budgeting requires analyzing more than upfront developer rates. It demands a holistic view of frontend frameworks, backend server requirements, API integrations, security compliance, store licensing, and long-term maintenance.
Industry analysis indicates that mobile digital transformation projects continue to expand rapidly, yet nearly 45% of initial mobile application budgets suffer overruns due to unaccounted backend integration complexity and post-launch operational upkeep. Understanding the precise breakdown of development hours, tech stack choices, and operational overhead empowers leaders to build realistic capital expense models and maximize software ROI.
2026 Mobile App Development Cost Breakdown at a Glance
To provide an immediate high-level map of the development lifecycle before exploring strategic choices and sourcing models, the table below outlines typical timelines, team composition, and cost tiers for iOS and Android projects in 2026:
| App Complexity Tier | Typical Scope & Features | Average Timeline | Hourly Rate Range | Estimated Cost Range |
|---|---|---|---|---|
| Basic / MVP App | 5–8 static/dynamic screens, basic authentication, standard UI, local storage, basic API sync | 6–10 Weeks | $35 – $65 / hr | $15,000 – $35,000 |
| Medium Complexity App | Custom UI/UX, payment gateway, real-time chat/push, admin panel, role-based access, third-party integrations | 12–18 Weeks | $45 – $85 / hr | $35,000 – $90,000 |
| Complex / Enterprise App | Multi-role backend, offline sync, microservices, advanced security (HIPAA/GDPR), AI/ML engines, streaming or IoT sync | 20–36+ Weeks | $60 – $120 / hr | $90,000 – $250,000+ |
Key Factors Influencing Mobile App Development Cost
Understanding what drives the primary budget requires breaking down core architectural variables without getting bogged down in implementation-level engineering micro-tasks.
1. Strategic Feature Scope & Quote Verification Benchmarks
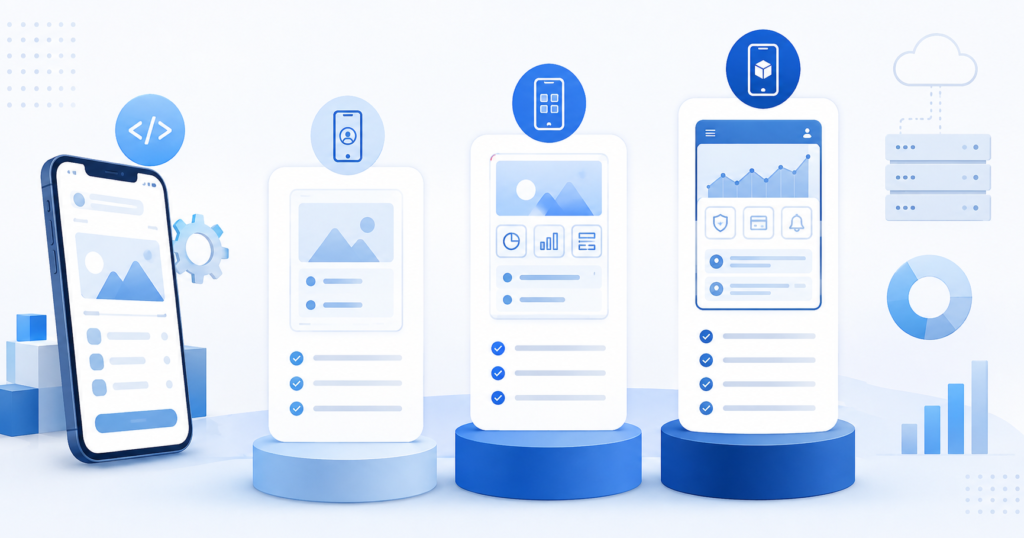
From an executive perspective, feature scope dictates capital allocation. From a technical sourcing perspective, project managers need benchmark estimates to sanity-check vendor proposals. Below is a quote verification benchmark mapping core feature modules to typical engineering effort:
| Feature Module | Business Purpose | Typical Engineering Hours | Quote Impact |
|---|---|---|---|
| Auth & Biometric Security | OAuth 2.0, FaceID/TouchID, MFA, Role Management | 40–80 Hours | $2,000 – $5,000 |
| Real-Time Data & Chat | WebSockets, live sync, push messaging, audio/video | 100–180 Hours | $6,000 – $14,000 |
| Payment & Billing Engines | Stripe, Apple/Google Pay, subscriptions, invoicing | 40–70 Hours | $2,500 – $5,500 |
| Custom Admin Portal | User governance, analytics, content management, roles | 80–160 Hours | $5,000 – $12,000 |
| Geolocation & Routing | GPS tracking, geofencing, route calculation APIs | 60–120 Hours | $3,500 – $9,000 |
2. UI/UX Design Depth and Prototyping
Design is a strategic risk mitigation tool—it directly dictates user adoption, task completion rates, and app store ratings. Standard wireframing and UI kit customization for a simple app cost around $3,000 to $6,000. However, custom enterprise applications requiring dedicated user journey mapping, design systems, micro-interactions, accessibility compliance (WCAG 2.1 AA), and interactive Figma prototyping range between $8,000 and $20,000+. Engaging specialized UI/UX design services prevents expensive redesign cycles post-launch.
Native vs. Cross-Platform Cost Implications: iOS and Android
Choosing your mobile tech stack is primarily a strategic business decision balancing initial capital efficiency against platform-specific hardware capabilities.
Native Development (Swift/SwiftUI + Kotlin/Jetpack Compose)
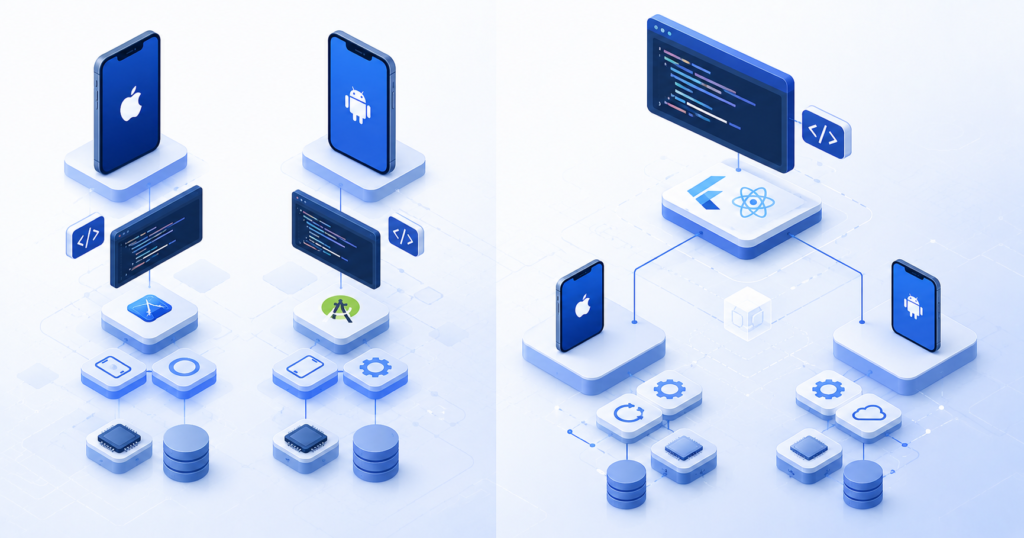
Native development requires engineering two separate codebases: Swift for iOS and Kotlin for Android.
- Strategic Advantage: Maximum hardware access, superior frame-rate performance for heavy 3D or AR/VR features, and immediate access to zero-day OS features.
- Budget & Sourcing Impact: High. Requires separate teams of iOS developers and Android developers, essentially doubling frontend engineering expenses.
- Cost Premium: 35% to 50% higher initial capital outlay.
Cross-Platform Development (Flutter & React Native)
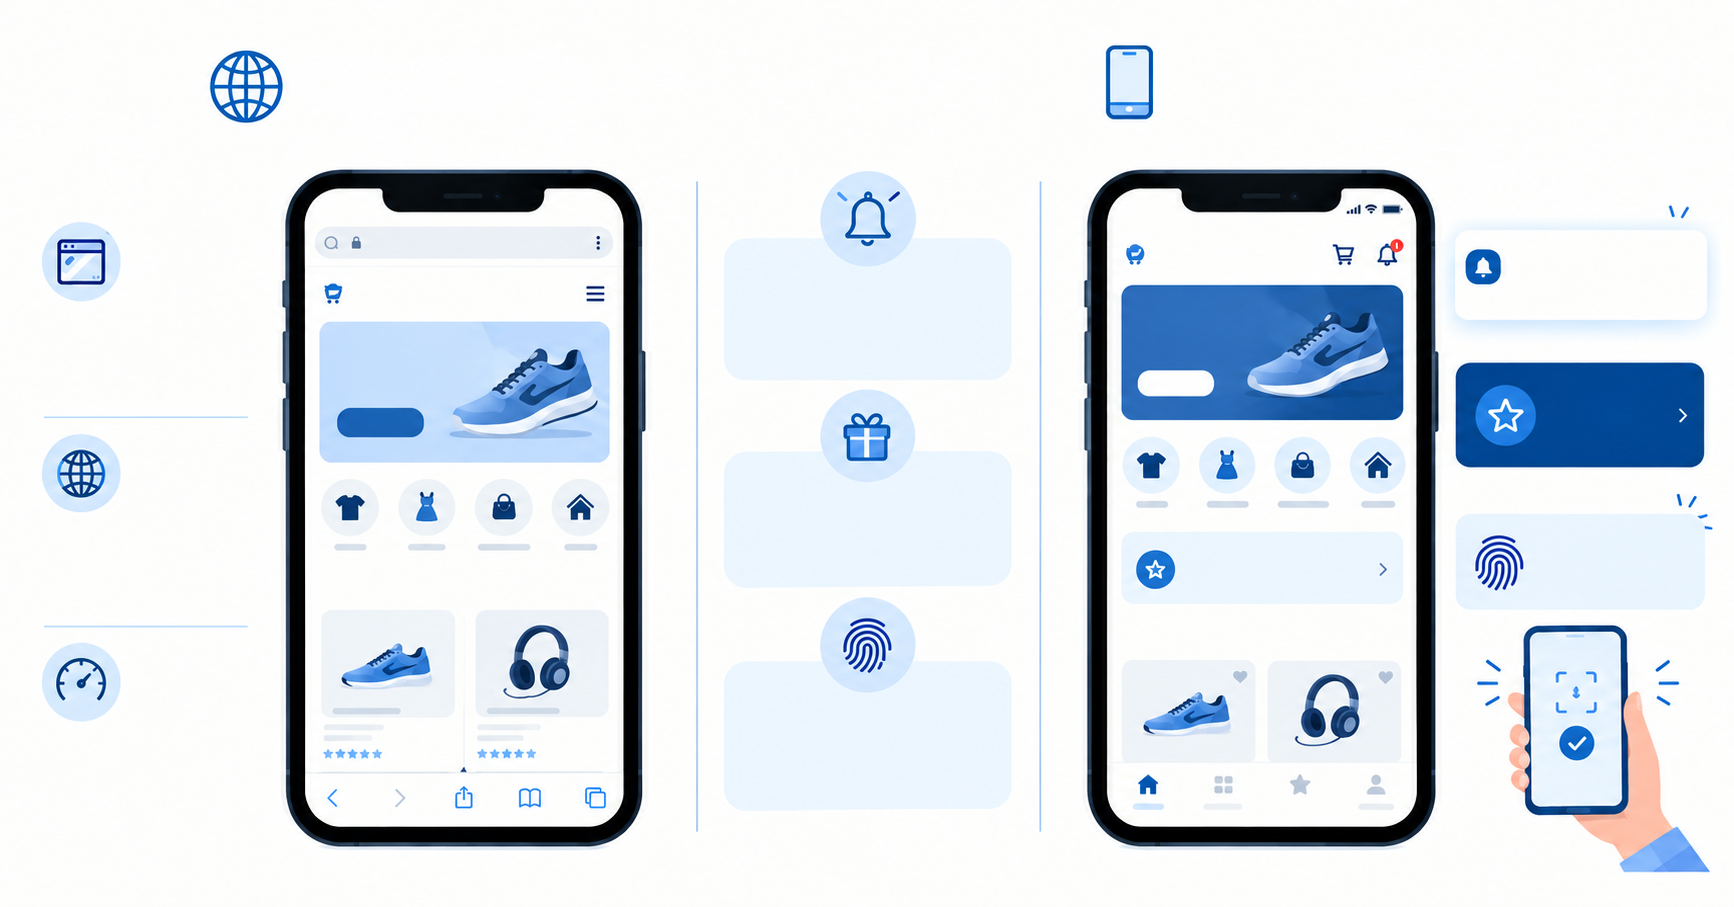
Cross-platform frameworks compile a single unified codebase to both iOS and Android platforms with near-native responsiveness. As detailed in our comparison of Flutter vs React Native, cross-platform tools represent a highly cost-effective choice for standard business applications.
- Strategic Advantage: Up to 85% shared business logic, unified engineering team, synchronized platform releases, and 40% faster time-to-market.
- Budget & Sourcing Impact: Highly economical. A single team of experienced Flutter developers or React Native developers handles both stores simultaneously.
- Cost Savings: 30% to 40% reduction in total initial development hours.
| Parameter | Native iOS (Swift) & Android (Kotlin) | Cross-Platform (Flutter / React Native) | Strategic Consideration |
|---|---|---|---|
| Codebases | 2 Separate Repositories | 1 Shared Repository | Maintenance complexity |
| Time-to-Market | High (16–24+ Weeks) | Fast (10–14 Weeks) | Market entry speed |
| Initial Cost | Baseline (100%) | 30%–40% Savings | Capital efficiency |
| Hardware Access | 100% Direct OS Access | 95%–98% via Plugins | Feature requirements |
| Maintenance Effort | Dual Team Maintenance | Single Team Maintenance | OPEX impact |
Mobile App Sourcing Models: Fixed Price vs. Time & Materials vs. Dedicated Team
When evaluating development partners, technical leaders and procurement managers must choose an engagement model that matches project scope clarity and risk tolerance.
| Engagement Model | How Pricing Works | Best Used When… | Client Risk Level | Vendor Risk Level |
|---|---|---|---|---|
| Fixed Price (Lump Sum) | Set budget for a rigid, pre-defined scope of work | Scoping requirements are 100% frozen and unlikely to change | Low (Cost bounded) | High (Scope creep risk) |
| Time & Materials (T&M) | Billed on actual hours worked at agreed hourly rates | Product scope is evolving, agile, or requires ongoing discovery | Medium (Flexibility vs cost) | Low (Billed for effort) |
| Dedicated Team / Staff Aug | Monthly retainer for dedicated senior developers | Scaling in-house capacity or executing long-term roadmaps | Low to Medium | Low (Retainer based) |
Choosing the right engagement model is pivotal. Fixed-price contracts provide budget certainty for simple MVPs but often include a 20%–30% contingency buffer built into the vendor’s price to cover risk. Conversely, T&M provides maximum agility for complex products. For companies managing internal engineering backlogs, leveraging flexible staff augmentation allows leadership to scale specialized talent without long-term headquarter overhead.
Backend Infrastructure, APIs, and Cloud Hosting Costs
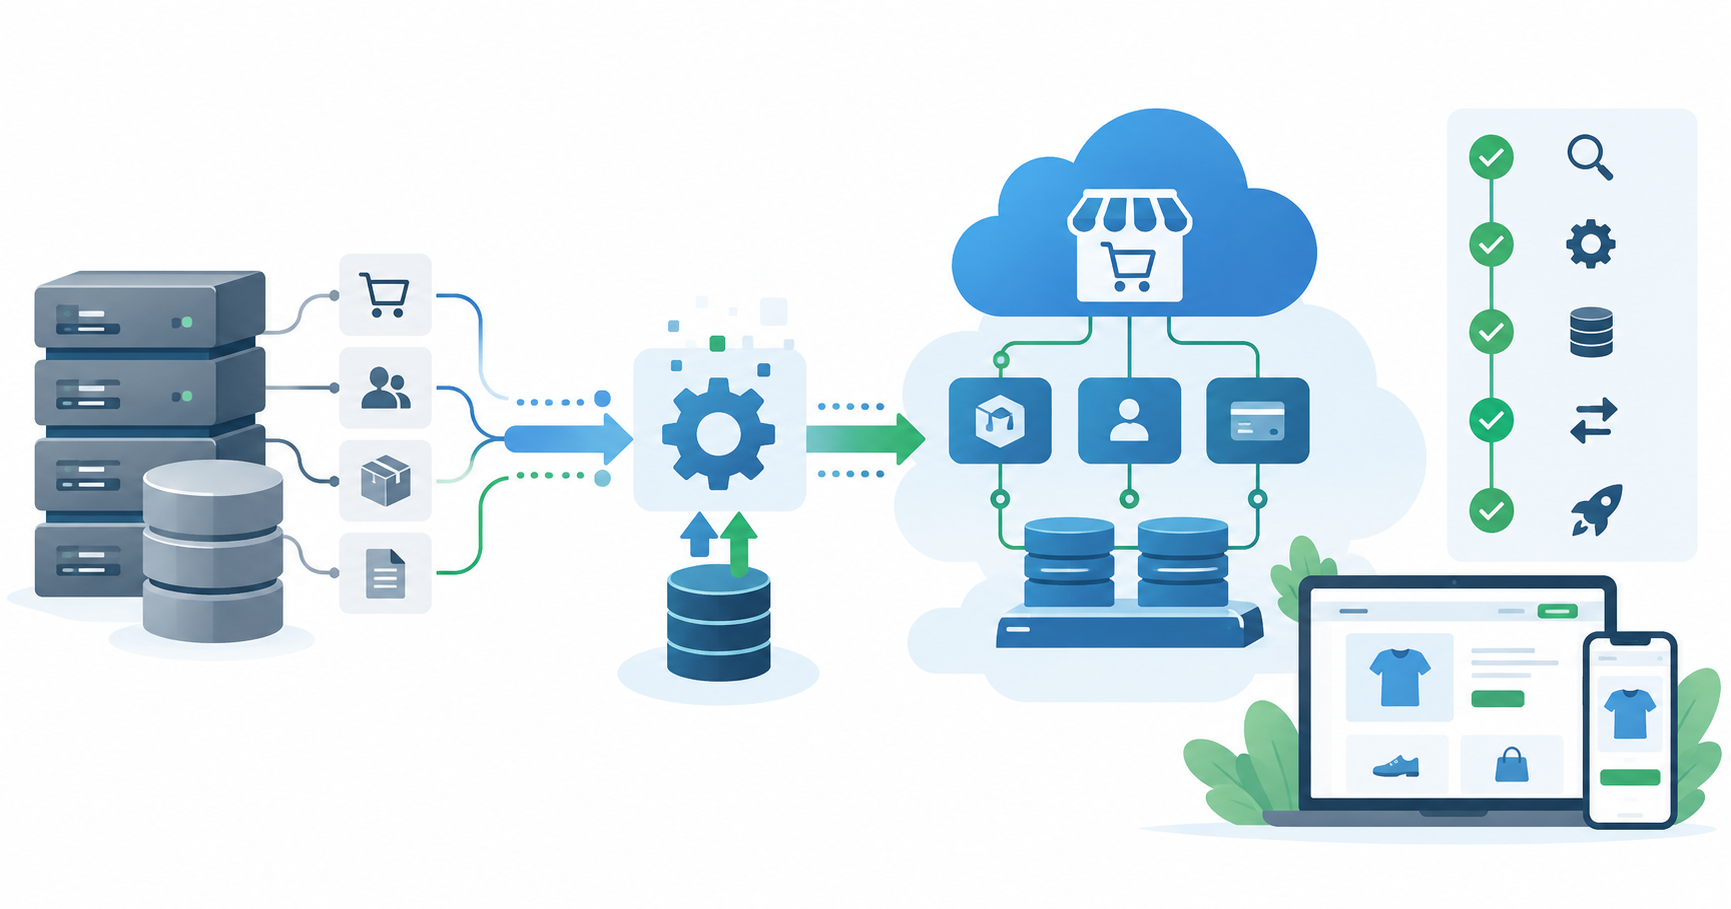
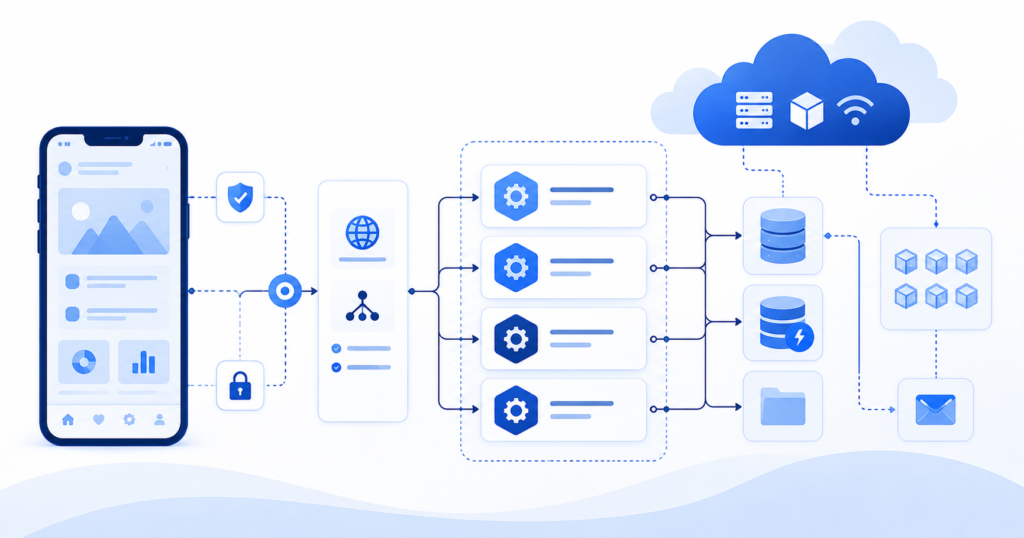
A mobile application is only as responsive and secure as its underlying backend architecture. Unless an application operates completely offline, cloud backend infrastructure is a continuous operational cost.
1. Cloud Server Hosting (AWS, GCP, Azure, Firebase)
For early-stage products, serverless platforms like Firebase or AWS Amplify cost $50 to $200 per month. As Monthly Active Users (MAU) grow, enterprise cloud environments managed through cloud infrastructure services scale accordingly:
- Startup / MVP (< 10,000 MAU): $50 – $300 / month
- Mid-Market (10,000 – 100,000 MAU): $300 – $1,200 / month
- Enterprise Scale (100,000+ MAU): $1,500 – $5,000+ / month
2. Third-Party Microservices & API Licensing
- SMS & Authentication (Twilio): Outbound SMS rates start at ~$0.0079 per message in the US (Source: Twilio Official API Pricing).
- Push Notifications (OneSignal / FCM): Free tiers scaling to $99+/month.
- Location & Maps (Google Maps / Mapbox): Dynamic Maps API requests range from $2.00 to $7.00 per 1,000 calls after monthly free credits (Source: Google Maps Platform Pricing).
- AI Integration (OpenAI / LLM APIs): Usage-based token fees ranging from $100 to $2,000+/month.
3. Compliance and Data Security Architectures
If your application processes sensitive healthcare information, financial transactions, or enterprise records, security engineering is mandatory. Implementing HIPAA compliance, GDPR privacy standards, and SOC 2 readiness typically adds $10,000 to $25,000 during initial backend development.
App Store and Google Play Licensing & Publishing Fees
Publishing software on public marketplaces requires accounting for mandatory vendor fees and revenue-share commissions.
Developer Account Licensing Fees
- Apple Developer Program: Requires $99 per year for standard accounts ($299/year for the Enterprise Program for internal employee app distribution) (Source: Apple Developer Program Documentation).
- Google Play Console: Requires a $25 one-time registration fee (Source: Google Play Console Documentation).
Marketplace Commissions & Quotation Exclusions
- In-App Digital Purchases & Subscriptions: Standard store commission is 30%, which drops to 15% under Apple’s Small Business Program and Google Play’s reduced tier for developers earning under $1 million annually.
- Important Quote Exclusion: Store licensing fees are paid directly by your corporate credit card to Apple and Google. Software development agencies handle app submission pipelines but never bundle store registration fees into development estimates.
Ongoing Mobile App Maintenance and Operating Expenses
Deploying your app to the store is the start of the operational lifecycle, not the end of investment.
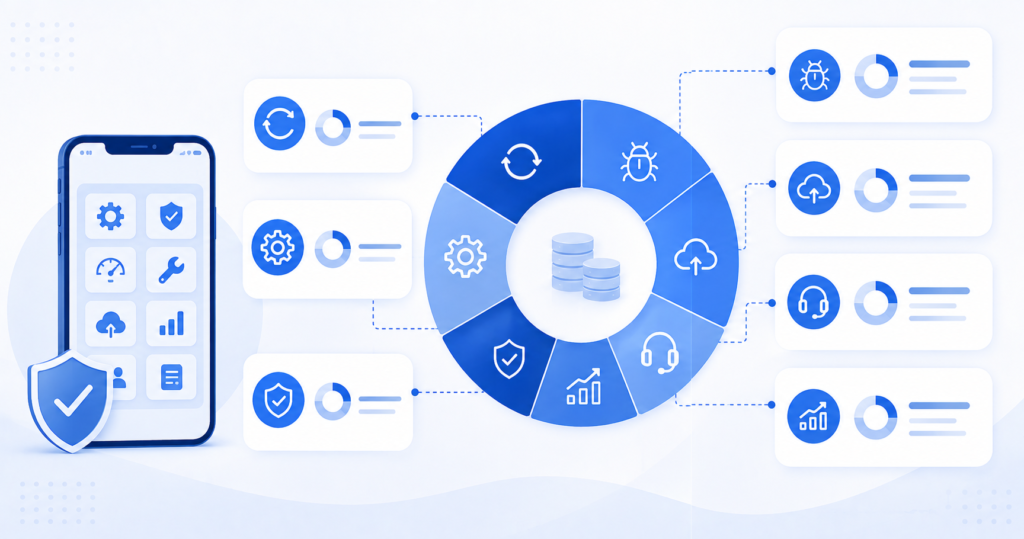
Industry benchmarks establish that annual maintenance costs 15% to 20% of the initial development cost. For an app built for $60,000, plan for $9,000 to $12,000 per year in operational upkeep.
Maintenance Coverage Areas:
- Annual OS Version Support: Apple (iOS releases) and Google (Android releases) update their operating systems every autumn. Keeping apps compliant with new permissions and APIs requires 40–80 engineering hours annually.
- Security & Dependency Patching: Updating third-party SDKs, payment gateways, and security libraries.
- Performance Optimization: Resolving runtime bugs surfaced by Crashlytics or Sentry.
- Regression Testing: Routine validation via dedicated QA services before major store updates.
For further analysis on scheduling maintenance versus initial development sprints, see our guide on software project timeline and budget factors 2026.
Building the Internal Business Case: ROI, Payback Period, and CFO Alignment
For C-suite executives and innovation leaders, securing budget approval requires converting a software estimate into a compelling business case.
1. Mapping Costs to Revenue & Value Drivers
Mobile applications generate return through direct or indirect financial mechanisms:
- Direct Revenue Apps (Consumer/SaaS): Subscriptions, in-app purchases, or transaction fees. ROI is measured by Customer Acquisition Cost (CAC) vs. Lifetime Value (LTV).
- Internal Enterprise Apps (Workflow/Ops): Labor efficiency, error reduction, and field service acceleration. ROI is measured by hours saved per employee multiplied by fully loaded labor rates.
2. Typical Payback Period Benchmarks
- Commercial Customer Apps: Typically achieve break-even within 12 to 18 months post-launch as user acquisition scales.
- Internal Operational Apps: Often achieve payback within 6 to 12 months by eliminating manual data entry and paper-based workflows.
3. Presenting the Budget to the Board or CFO
- Phase Scope via MVP: Propose an initial Version 1.0 (MVP) representing 50%–60% of total roadmap budget to validate market demand before committing Phase 2 capital. Read our MVP development cost guide 2026 for framework strategies.
- Separate CAPEX from OPEX: Treat initial design and development as Capital Expenditure (CAPEX) for asset creation, while categorizing hosting, APIs, and maintenance as Operational Expenditure (OPEX).
Evaluating Vendor Quotes: Red Flags and Hidden Cost Drivers
When comparing bids from software agencies, lowball quotes frequently conceal hidden omissions that cause severe budget inflation later.
Red Flags in Lowball Quotes:
- Excluding QA and Testing: Vendor quotes frontend coding hours but leaves regression testing to your team, leading to launch bugs.
- Omitting Backend & API Architecture: Low quotes assume simple dummy data, ignoring real backend databases, security, or API integrations.
- Vague Intellectual Property (IP) Ownership: Contracts that retain software IP or require licensing fees to transfer code.
- Junior Developer Bait-and-Switch: Presenting senior engineers during sales calls but assigning junior developers to execution.
- Exorbitant Change Order Fees: Low upfront bids combined with strict change-request hourly rates ($150+/hr) for minor scope tweaks.
Reviewing real-world case studies—such as custom mobile solutions built for USA Travels, SmartHealthAssist, or Westhill Trucking—helps project managers verify realistic scope delivery. For strategic technology alignment, engaging expert business consulting before signing vendor contracts ensures risk mitigation.
Common Budgeting Mistakes to Avoid in Mobile App Development
- Over-Engineering Version 1.0: Attempting to launch with dozens of non-essential features inflates costs and delays user feedback.
- Ignoring Post-Launch Infrastructure & Marketing: Spending 100% of capital on coding with zero reserve for hosting, acquisition, or app store optimization.
- Choosing Native for Standard Business Apps: Building dual native codebases when Flutter or React Native achieves identical performance wastes up to 40% of capital.
- Selecting Vendors Solely on Hourly Rates: Focusing exclusively on low hourly rates creates technical debt that requires expensive refactoring later.
Frequently Asked Questions (FAQs)
How much does a basic mobile app cost to develop in 2026?
A basic mobile app with a standard UI, simple authentication, and basic API integrations typically costs between $15,000 and $35,000. Development usually takes around 6 to 10 weeks, depending on the number of screens, integrations, and testing requirements. Using cross-platform frameworks such as Flutter or React Native can help keep development costs lower while supporting both iOS and Android.
Is it cheaper to develop for iOS or Android first?
Developing natively for iOS is often slightly faster initially because of Apple’s more standardized device and screen environment. However, choosing cross-platform development allows you to build for both iOS and Android from a shared codebase, which can be more cost-efficient overall. The right approach ultimately depends on your target audience, required features, and long-term product plans.
How much does cross-platform app development save compared to native?
Cross-platform frameworks such as Flutter and React Native allow developers to share a significant portion of the codebase between iOS and Android. This reduces duplicate frontend development work and can lower the initial development budget by approximately 30% to 40% compared with building two separate native applications. The actual savings depend on the app’s complexity, platform-specific requirements, and integrations.
What are the recurring annual costs of owning a mobile app?
Recurring costs typically include app maintenance, cloud hosting, developer account fees, third-party APIs, and other software subscriptions. Maintenance generally costs around 15% to 20% of the initial development cost per year, while cloud hosting can range from $50 to $1,500+ per month, depending on usage and infrastructure needs. You should also account for Apple’s $99/year Developer Program fee, Google’s $25 one-time developer account fee, and any paid APIs or services your app relies on.
How long does it take to build a custom business mobile app?
The timeline depends heavily on the app’s feature set, integrations, design requirements, and testing scope. A simple MVP typically takes 6 to 10 weeks, while a medium-complexity application can take 12 to 18 weeks. Complex enterprise mobile platforms may require 20 to 36+ weeks for design, engineering, integrations, security, and comprehensive QA testing.
Are App Store and Google Play fees included in developer quotes?
No. App Store and Google Play developer account fees are generally separate from the development quote and should be paid directly by your business. Apple charges $99 per year for its Developer Program, while Google Play charges a $25 one-time registration fee. Registering the accounts under your company’s ownership also ensures that your business retains control of the app listings and publishing credentials.
What is the difference between Fixed Price and Time & Materials contracts?
A Fixed Price contract establishes a defined budget based on a clearly agreed scope of work. It works best when requirements are well documented and unlikely to change significantly during development. A Time & Materials (T&M) contract bills based on the actual engineering hours or resources used, making it more suitable for products where requirements may evolve and features need to be adjusted as development progresses.
What is the best way to get an accurate mobile app development quote?
Start by creating a clear Product Requirements Document (PRD) that outlines the app’s goals, features, user roles, integrations, and technical requirements. Define the essential user stories, identify your target platform or platforms, and clarify any third-party services or backend requirements. An experienced development partner can then convert this information into a detailed work breakdown structure, timeline, resource plan, and development estimate, giving you a much more reliable quote than a high-level feature list alone.
Building a Predictable Mobile App Budget
Managing your overall mobile app development cost requires balancing immediate feature engineering requirements against long-term operational maintenance, cloud infrastructure, and market growth. By choosing efficient cross-platform tech stacks, prioritizing essential MVP features, and partnering with experienced engineering teams, executives can launch high-performing iOS and Android applications while maintaining strict control over capital expenditure.
Ready to transform your app vision into an accurate, line-item budget? Explore our specialized mobile app development services or use our interactive calculator to estimate your project cost with detailed technical breakdowns within 24 hours.